While working on various projects, sometimes we need to display the data on charts. Currently showing a chart in the browser is not a problem. We can develop own solution or take advantage of the ready-made and tested solutions.
Creating charts in JavaScript and HTML5
Let’s do a little review of the proven solutions.
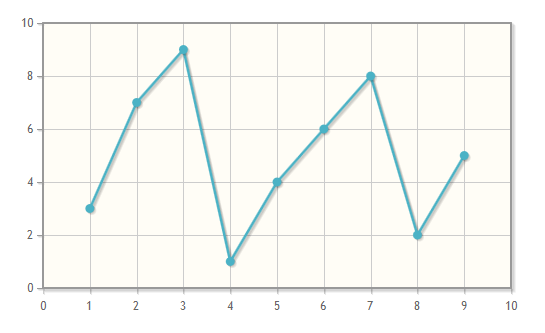
jqPlot
It’s a quite simple to use plugin with large possibilities.
To run the example, we need to include scripts: jqplot.canvasTextRenderer.min.js and jqplot.canvasAxisLabelRenderer.min.js. Then we can add the JavaScript code to draw the chart:
$(document).ready(function() {
  var plot1 = $.jqplot ('chart1', [[3,7,9,1,4,6,8,2,5]]);
});
Parameters: ID of canvas element and an array of points.
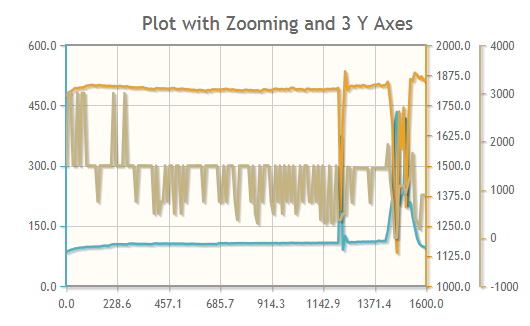
There we have, among others, line charts, bar, pie and point charts, labels for the axis and options, loading data from JSON (Ajax), zooming and more.
Documentation and more examples on the project website:
http://www.jqplot.com/docs/files/usage-txt.html
Another solution, which we used successfully, is based on the Dojo framework.
Framework Dojo Toolkit offers both — basic:
http://dojotoolkit.org/documentation/tutorials/1.9/charting/
and advanced:
http://dojotoolkit.org/documentation/tutorials/1.9/charting_advanced/
charting capabilities.
As we would expect in the case of Dojo, we get a complete toolbox to do our task.
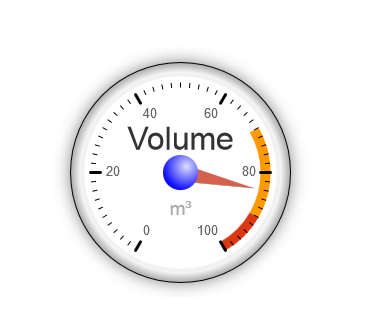
rGraph
This an interesting library allows to create eye-catching charts in HTML5 and JavaScript. Available under the MIT license.
It has all kinds of graphs, also unusual, e.g.:
Wealth of examples presented here:
http://www.rgraph.net/examples/index.html
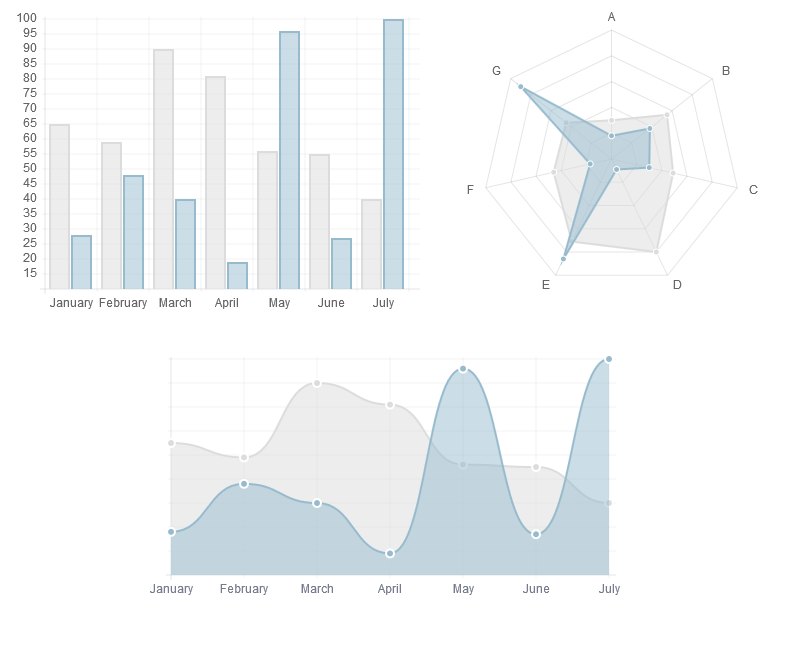
Chart.js
This is an advanced library with rich features. Both developers and designers can use it in their projects without any problems.
WWW:
More?
If you are looking for something different, perhaps this collection of 30 tools can help:
http://codegeekz.com/30-best-tools-for-data-visualization/
Charts in JavaScript — summary
As we can see, there is no shortage of good quality solutions, so that we can place charts on our websites and web applications, without major problems.
Thank you for your attention.
 Posted in
  Tags:
Tags:
http://www.noupe.com/design/chartist-js-creates-responsive-animated-charts-with-svg-88363.html