
We’ve already published a basic course of HTML5, with a solid foundation for learning (or reminders). With such basics we can dive into more advanced (and interesting) topics. Learning HTML5 Canvas can be disassembled into smaller parts, and to handle them step by step.
Learning HTML5 Canvas
Learning goes great through the implementation of specific examples, so… Here we go, with a simple way to start doing cool things in HTML5.
Let’s create a template, where we will run the test code:
<!DOCTYPE html>
<html lang="en">
<head>
    <meta charset="utf-8">

    <script type="application/javascript">
    function draw() {
        var canvas = document.getElementById("canvas");
        var ctx = canvas.getContext("2d");

        // the code goes HERE …

    }

    </script>
 </head>

 <body onload="draw()">
     <canvas id="canvas" width="500" height="300"
         style="border: solid 1px;"></canvas>
 </body>

</html>
At the very beginning: path and drawing straight lines. We use two functions:
moveTo(x, y) — defines the starting point of the line,
lineTo(x, y) — the ending point.
The line will be created between these two points.
Example #1 — drawing a line:
// …
ctx.moveTo(0, 0);
ctx.lineTo(300, 150);

// set line color
ctx.strokeStyle = '#0000ff';
ctx.stroke();
We define parameters of the line (e.g. color). After executing this code, we should get following result:

HTML5 Canvas: draw a line
Simple. So now let’s try to draw a rectangle and a circle.
To draw a rectangle we need the rect(x, y, w, h) method.
Example #2 — drawing a rectangle on HTML5 Canvas:
// …
ctx.beginPath();
ctx.rect(20, 20, 250, 150);
ctx.fillStyle = '#000000';
ctx.fill();
ctx.lineWidth = 3;
ctx.strokeStyle = '#0000ff';
ctx.stroke();
We defined basic parameters (color, border) and the effect is:
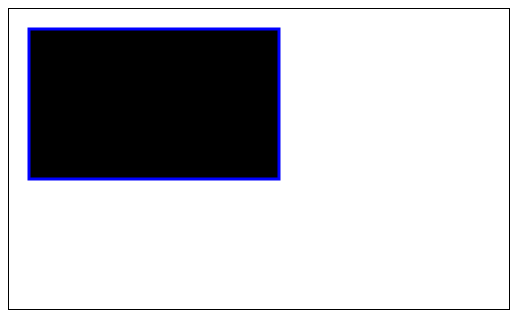
HTML5 Canvas: rectangle
To draw a circle, the arc(x, y, r, start, stop) method is used.
Example #3 — drawing a circle:
// #1
ctx.beginPath();
ctx.arc(100, 100, 50, 0, 2 * Math.PI);
ctx.stroke();

// #2
ctx.beginPath();
ctx.arc(380, 100, 50, 0, 2 * Math.PI);
ctx.stroke();
In this example, we draw two circles that look like this:
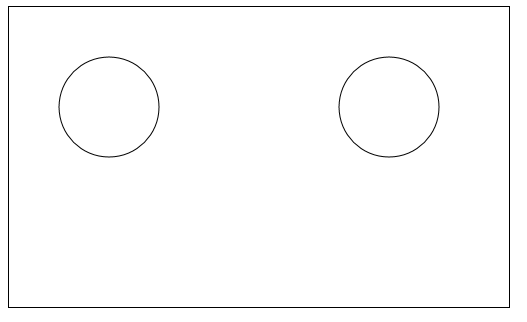
HTML5 Canvas: circle
HTML5 Canvas and text
The Canvas wouldn’t be so cool without the possibility of text writing. Fortunately, it’s quite simple.
The most important methods and parameters adjustable for the context, in this case are:
font — here we define font settings for our text,
fillText(text, x, y) — this method draws a filled text at a given position,
strokeText(text, x, y) — draws text without filling.
Example #4 — our text on HTML5 Canvas:
// …
ctx.font = "32px Verdana";
ctx.fillText("Learning HTML5 Canvas", 5, 40);
An example above displays the filled text, while the following code:
// …
ctx.font = "32px Verdana";
ctx.strokeText("Learning HTML5 Canvas", 5, 40);
displays text without filling:
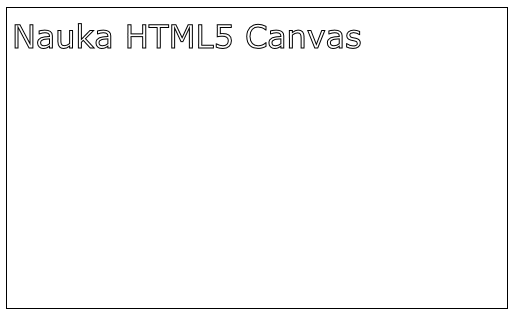
HTML5 Canvas: text render
HTML5 Canvas and creating a gradient
Gradients are used to fill other graphic objects (shapes), usually where we don’t want solid colors.
We can create a linear gradient:
createLinearGradient(x, y, x1, y1)
or “circular”:
createRadialGradient(x, y, r, x1, y1, r1).
Then specify the color transitions (color stops). For this we use the addColorStop() method.
Example #5 — gradient:
// …
var g = ctx.createLinearGradient(0, 0, 200, 0);
g.addColorStop(0, "blue");
g.addColorStop(1, "white");

// fill with gradient
ctx.fillStyle = g;
ctx.fillRect(10, 10, 200, 100);
And here is the result:
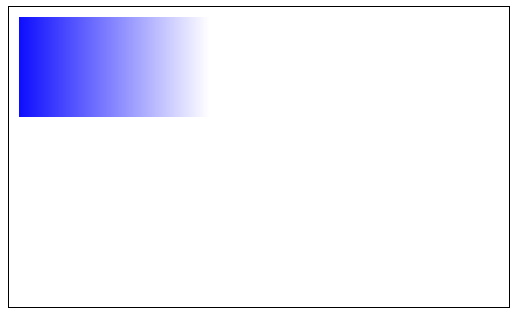
HTML5 Canvas: gradient
A simple chart in HTML5
We finish this article about learning HTML5 Canvas with a simple example: bar graph.
Simply define the input and loop that passes over them, and draws a sufficiently high stakes.
Example #6 — bar graph:
// …

// data
var inputData = [99, 60, 20, 10, 10, 70, 125, 100];

var canvasWidth = 500;

// the place from where we start drawing
var x_from = 40;

// the distance between the posts
var step = Math.round(canvasWidth / inputData.length) - 5;

for (var i = 0; i < inputData.length; i++) {
    // the x position of the next post
    var x_next = x_from + (i * step) - 20;

    // drawing a post…
    ctx.fillStyle = "rgba(50, 150, 250, 1)";
    ctx.fillRect(x_next, 150, 40, -inputData[i]);

    // and its shadow
    ctx.fillStyle = "rgba(10, 10, 50, 0.4)";
    ctx.fillRect(x_next, 150, 45, -inputData[i]);
}
And here is the result:
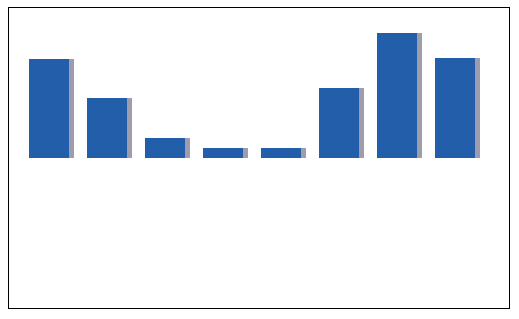
HTML5 Canvas: chart
And for the curious — recommended resources:
– Canvas reference on W3Schools:
http://www.w3schools.com/tags/ref_canvas.asp
– Practical examples with a brief commentary:
http://www.tutorialspoint.com/html5/html5_canvas.htm
Learning HTML5 Canvas — summary
This concludes today’s article. More advanced examples coming soon. In the end, learning is also a constant practice and experimentation.
Thank you and have fun with HTML5 Canvas!
 Posted in
  Tags:
Tags:
Additionally:
http://eloquentjavascript.net/16_canvas.html