
The last time I worked on the web application, of which a large part was the presentation of processed data in tabular form, with the possibility of sorting, etc. We had to find a good and quick solution for this purpose.
Tables in JavaScript — solutions
There is a small list of good solutions.
1. Dynatable.js
It’s quite a fresh look at the issue of creating solutions for tabular data in JavaScript. Dynatable.js is a jQuery plugin, also based on HTML5 and JSON.
This solution allows quite comfortably reproduce the data in the form of an interactive table. There are also many opportunities, such as search (filtering), creating a table with pagination, sorting, embedding images and more.
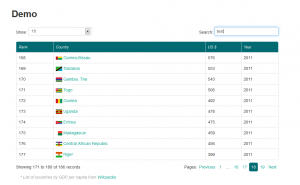
Dynatable.js — demo
The website contains excellent documentation with examples. Available licenses: Open-source and commercial.
URL:
2. DataTables
I know this solution from one of older projects.
It is high quality product, with a paid support. Working with this solution was quite nicely.
As jQuery plugin, it’s easy to use:
$(document).ready(function() {
    $('#test-table').dataTable();
});
It also has a lot of customization options, including painless definition of CSS styles for tables.
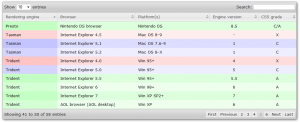
DataTables — tabele w JavaScript
Available on GPL or BSD license.
URL:
http://datatables.net/examples/
3. jqGrid
Another solution to create tables in JavaScript is also a jQuery plugin — called jqGrid.
It’s an advanced solution for a variety of capabilities, which you can try on the Demo page.
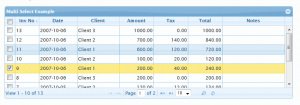
jqGrid
URL:
http://trirand.com/blog/jqgrid/jqgrid.html
4. jQuery HighchartsTable
Tables in JavaScript are not enough? No problem. jQuery HighchartsTable a solution that allows you to present data not only as tables, but also as the charts!
Solution really great, and easy to use.
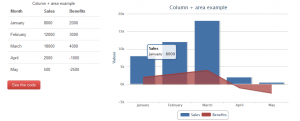
jQuery HighchartsTable
The programmer has many configuration options, so that can precisely adjust the charts.
Solution available under the MIT license.
URL:
http://pmsipilot.github.io/jquery-highchartTable-plugin/
And here I would like to end today’s small overview of the solutions.
Summary
At present, there is a whole bunch of solutions to support the work with tables in JavaScript. Feel free to comment, especially if you want to recommend own solutions.
Thank you.

 Posted in
  Tags:
Tags: 
