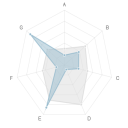
While working on various projects, sometimes we need to display the data on charts. Currently showing a chart in the browser is not a problem. We can develop own solution or take advantage of the ready-made and tested solutions. Creating charts in JavaScript and HTML5 Let’s do a little review of the proven solutions. jqPlot […]
Posts Tagged ‘charts’

Tables in JavaScript — recommended solutions
The last time I worked on the web application, of which a large part was the presentation of processed data in tabular form, with the possibility of sorting, etc. We had to find a good and quick solution for this purpose. Tables in JavaScript — solutions There is a small list of good solutions. 1. […]


 Posted in
  Tags:
Tags: